HUF76132SK8 데이터 시트보기 (PDF) - Intersil
부품명
상세내역
일치하는 목록
HUF76132SK8 Datasheet PDF : 11 Pages
| |||
HUF76132SK8
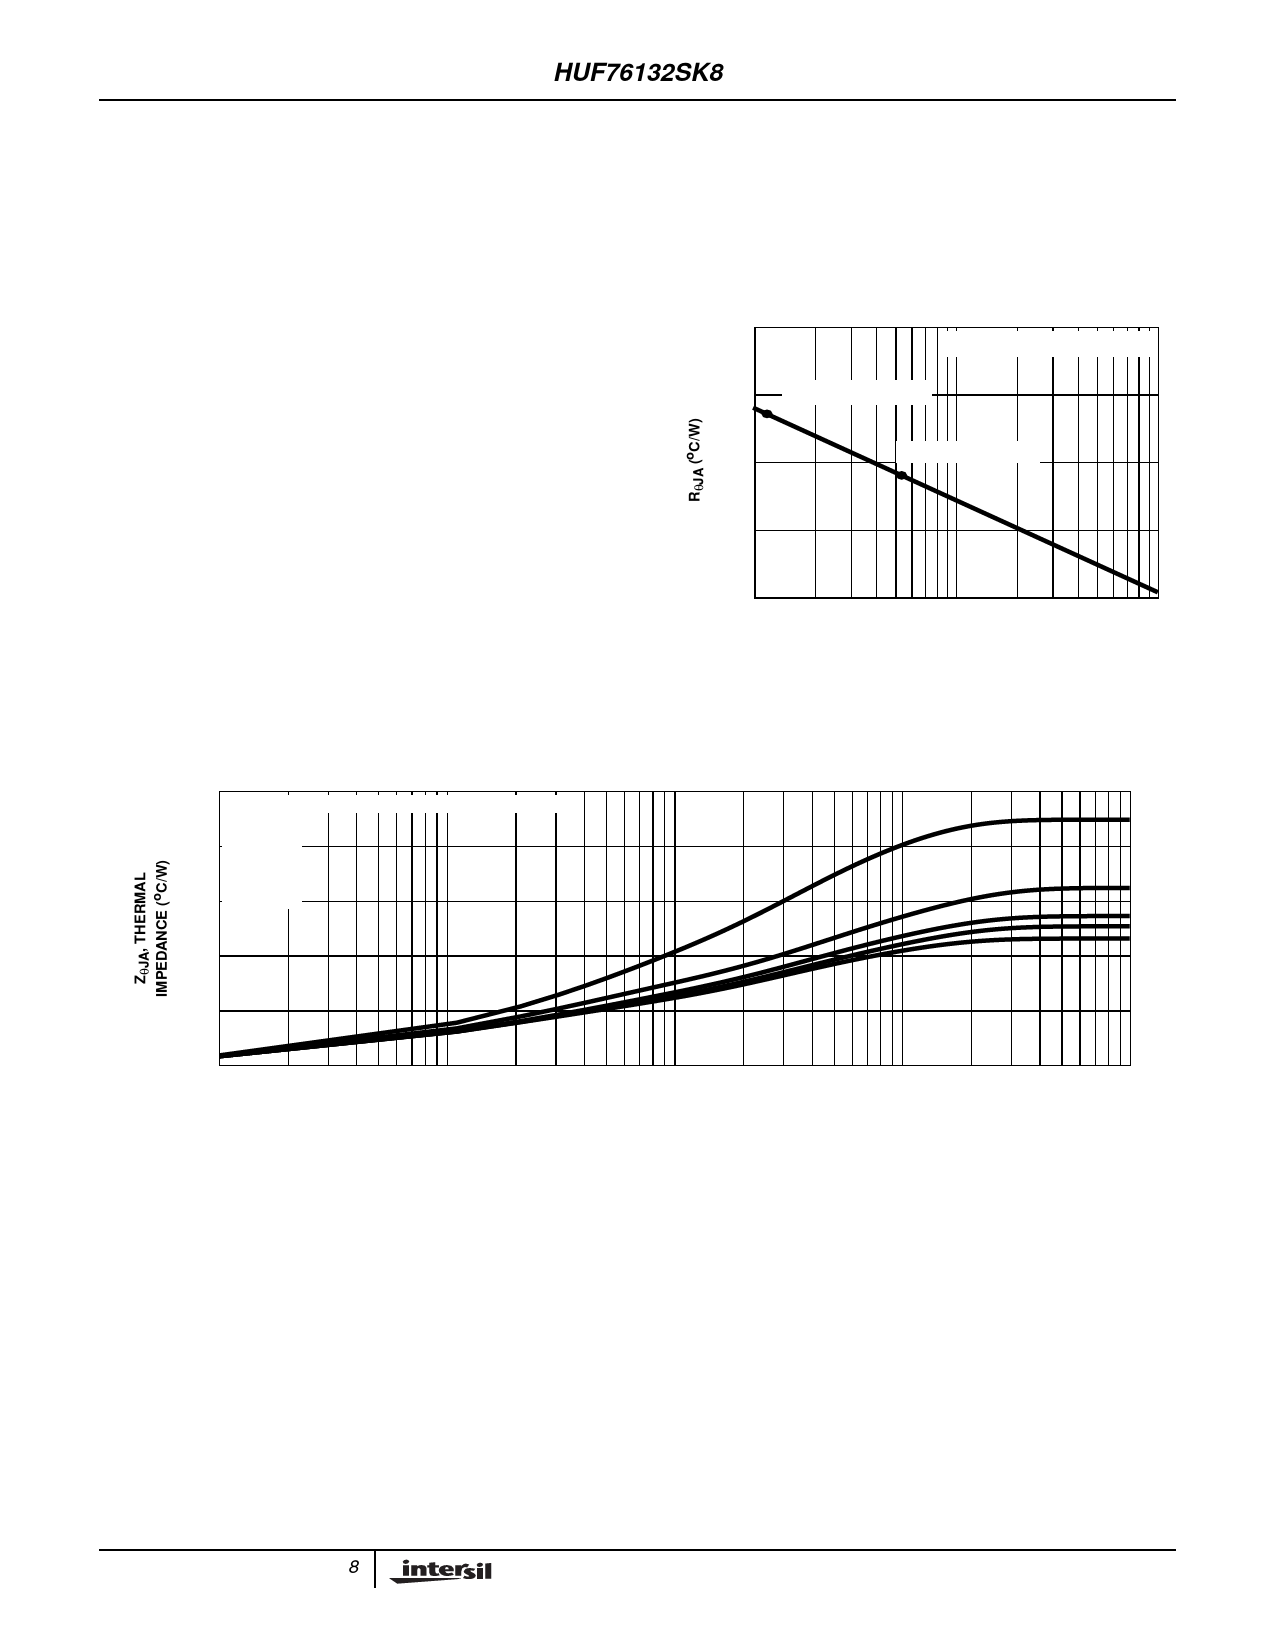
state power with no air flow. This graph provides the
necessary information for calculation of the steady state
junction temperature or power dissipation. Pulse
applications can be evaluated using the Intersil device Spice
thermal model or manually utilizing the normalized maximum
transient thermal impedance curve.
Displayed on the curve are RθJA values listed in the Electrical
Specifications table. The points were chosen to depict the
compromise between the copper board area, the thermal
resistance and ultimately the power dissipation, PDM.
Thermal resistances corresponding to other copper areas can
be obtained from Figure 23 or by calculation using Equation 2.
RθJA is defined as the natural log of the area times a
coefficient added to a constant. The area, in square inches is
the top copper area including the gate and source pads.
RθJA = 83.2 – 23.6 × ln (Area)
(EQ. 2)
The transient thermal impedance (ZθJA) is also effected by
varied top copper board area. Figure 24 shows the effect of
copper pad area on single pulse transient thermal
impedance. Each trace represents a copper pad area in
square inches corresponding to the descending list in the
graph. Spice and SABER thermal models are provided for
each of the listed pad areas.
150
COPPER BOARD AREA - DESCENDING ORDER
0.04 in2
120 0.28 in2
0.52 in2
0.76 in2
90 1.00 in2
Copper pad area has no perceivable effect on transient
thermal impedance for pulse widths less than 100ms. For
pulse widths less than 100ms the transient thermal
impedance is determined by the die and package. Therefore,
CTHERM1 through CTHERM5 and RTHERM1 through
RTHERM5 remain constant for each of the thermal models. A
listing of the model component values is available in Table 1.
240
ln RθJA = 83.2 - 23.6* (AREA)
200
189oC/W - 0.0115in2
160
152oC/W - 0.054in2
120
80
0.01
0.1
1.0
AREA, TOP COPPER AREA (in2)
FIGURE 23. THERMAL RESISTANCE vs MOUNTING PAD AREA
60
30
0
10-1
100
101
102
103
t, RECTANGULAR PULSE DURATION (s)
FIGURE 24. THERMAL IMPEDANCE vs MOUNTING PAD AREA
8
Share Link: 