NC12S0A0H15 데이터 시트보기 (PDF) - Unspecified
부품명
상세내역
일치하는 목록
NC12S0A0H15 Datasheet PDF : 14 Pages
| |||
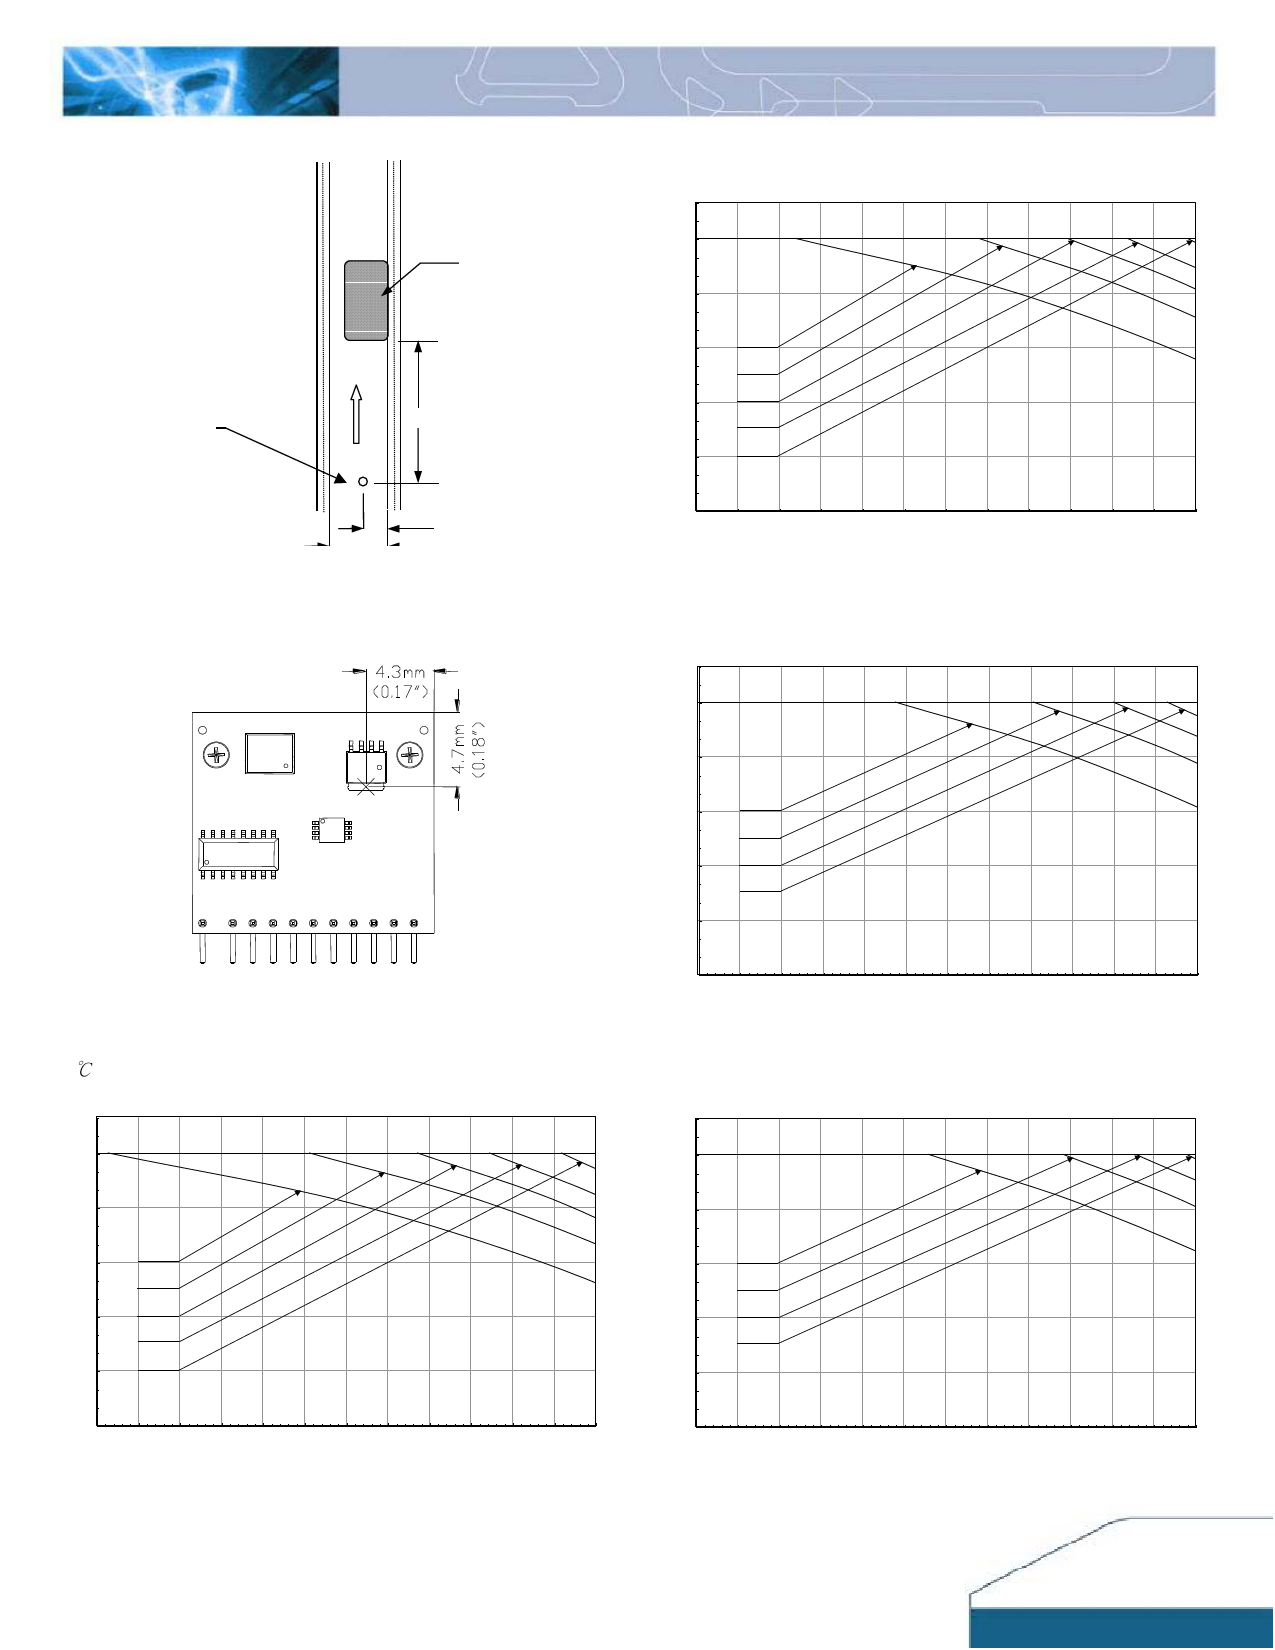
THERMAL CURVES (NC12S0A0V15)
FACING PWB
PWB
MODULE
AIR VELOCITY
AND AMBIENT
TEMPERATURE
MEASURED BELOW
THE MODULE
AIR FLOW
50.8 (2.0”)
17.5 (0.69”)
35 (1.38”)
Note: Wind Tunnel Test Setup Figure Dimensions are in
millimeters and (Inches)
Figure 32: Wind tunnel test setup
Figure 33: Temperature measurement location
* The allowed maximum hot spot temperature is defined at 130
℃
NC12S0A0V15 (Standard) Output Current vs. Ambient Temperature and Air Velocity
Output Current(A)
@ Vout = 5V (Either Orientation)
15
12
Natural
Convection
9
100LFM
200LFM
6
300LFM
400LFM
3
0
25
30
35
40
45
50
55
60
65
70
75
80
85
Ambient Temperature (℃)
Figure 34: Output current vs. ambient temperature and air
velocity@Vout=5V(Either Orientation)
NC12S15A_12022010
NC12S0A0V15 (Standard) Output Current vs. Ambient Temperature and Air Velocity
Output Current(A)
@ Vout = 3.3V (Either Orientation)
15
12
Natural
Convection
9
100LFM
200LFM
6
300LFM
400LFM
3
0
25
30
35
40
45
50
55
60
65
70
75
80
85
Ambient Temperature (℃)
Figure 35: Output current vs. ambient temperature and air
velocity@ Vout=3.3V(Either Orientation)
NC12S0A0V15 (Standard) Output Current vs. Ambient Temperature and Air Velocity
Output Current(A)
@ Vout = 1.8V (Either Orientation)
15
12
Natural
Convection
9
100LFM
200LFM
6
300LFM
3
0
25
30
35
40
45
50
55
60
65
70
75
80
85
Ambient Temperature (℃)
Figure 36: Output current vs. ambient temperature and air
velocity@ Vout=1.8V(Either Orientation)
NC12S0A0V15 (Standard) Output Current vs. Ambient Temperature and Air Velocity
Output Current(A)
@ Vout = 0.9V (Either Orientation)
15
12
Natural
Convection
9
100LFM
200LFM
6
300LFM
3
0
25
30
35
40
45
50
55
60
65
70
75
80
85
Ambient Temperature (℃)
Figure 37: Output current vs. ambient temperature and air
velocity@ Vout=0.9V(Either Orientation)
11
Share Link: 